
Understanding Best Trading Indicators: Liquidations, CVD, VWAP, Market Profile, and Keltner Channels
In the ever-evolving world of trading, having the right tools and understanding how to use them can make a significant difference in your trading success. Among the myriad of indicators available, some stand out due to their unique insights and applications. This guide will walk you through five essential trading indicators: Liquidations, Cumulative Volume Delta (CVD), Volume-Weighted Average Price (VWAP), Market Profile, and Keltner Channels. Each of these indicators offers distinct advantages and can be pivotal in shaping your trading strategies.
Let’s review together our best trading indicators for algo trading. They’re all available on our trading bot platform Runbot.io. Also feel free to ask any questions on our Discord Traders Community
1. Liquidation :
- What It Is: Liquidations happens when a trader’s position is automatically closed due to insufficient margin to support their open leveraged positions. It’s like a forced exit.
- How It Works: Should the market move unfavorably against a leveraged position, causing the account balance to drop below a required threshold, the platform will automatically initiate a liquidation to prevent losses that exceed the trader’s current account balance.
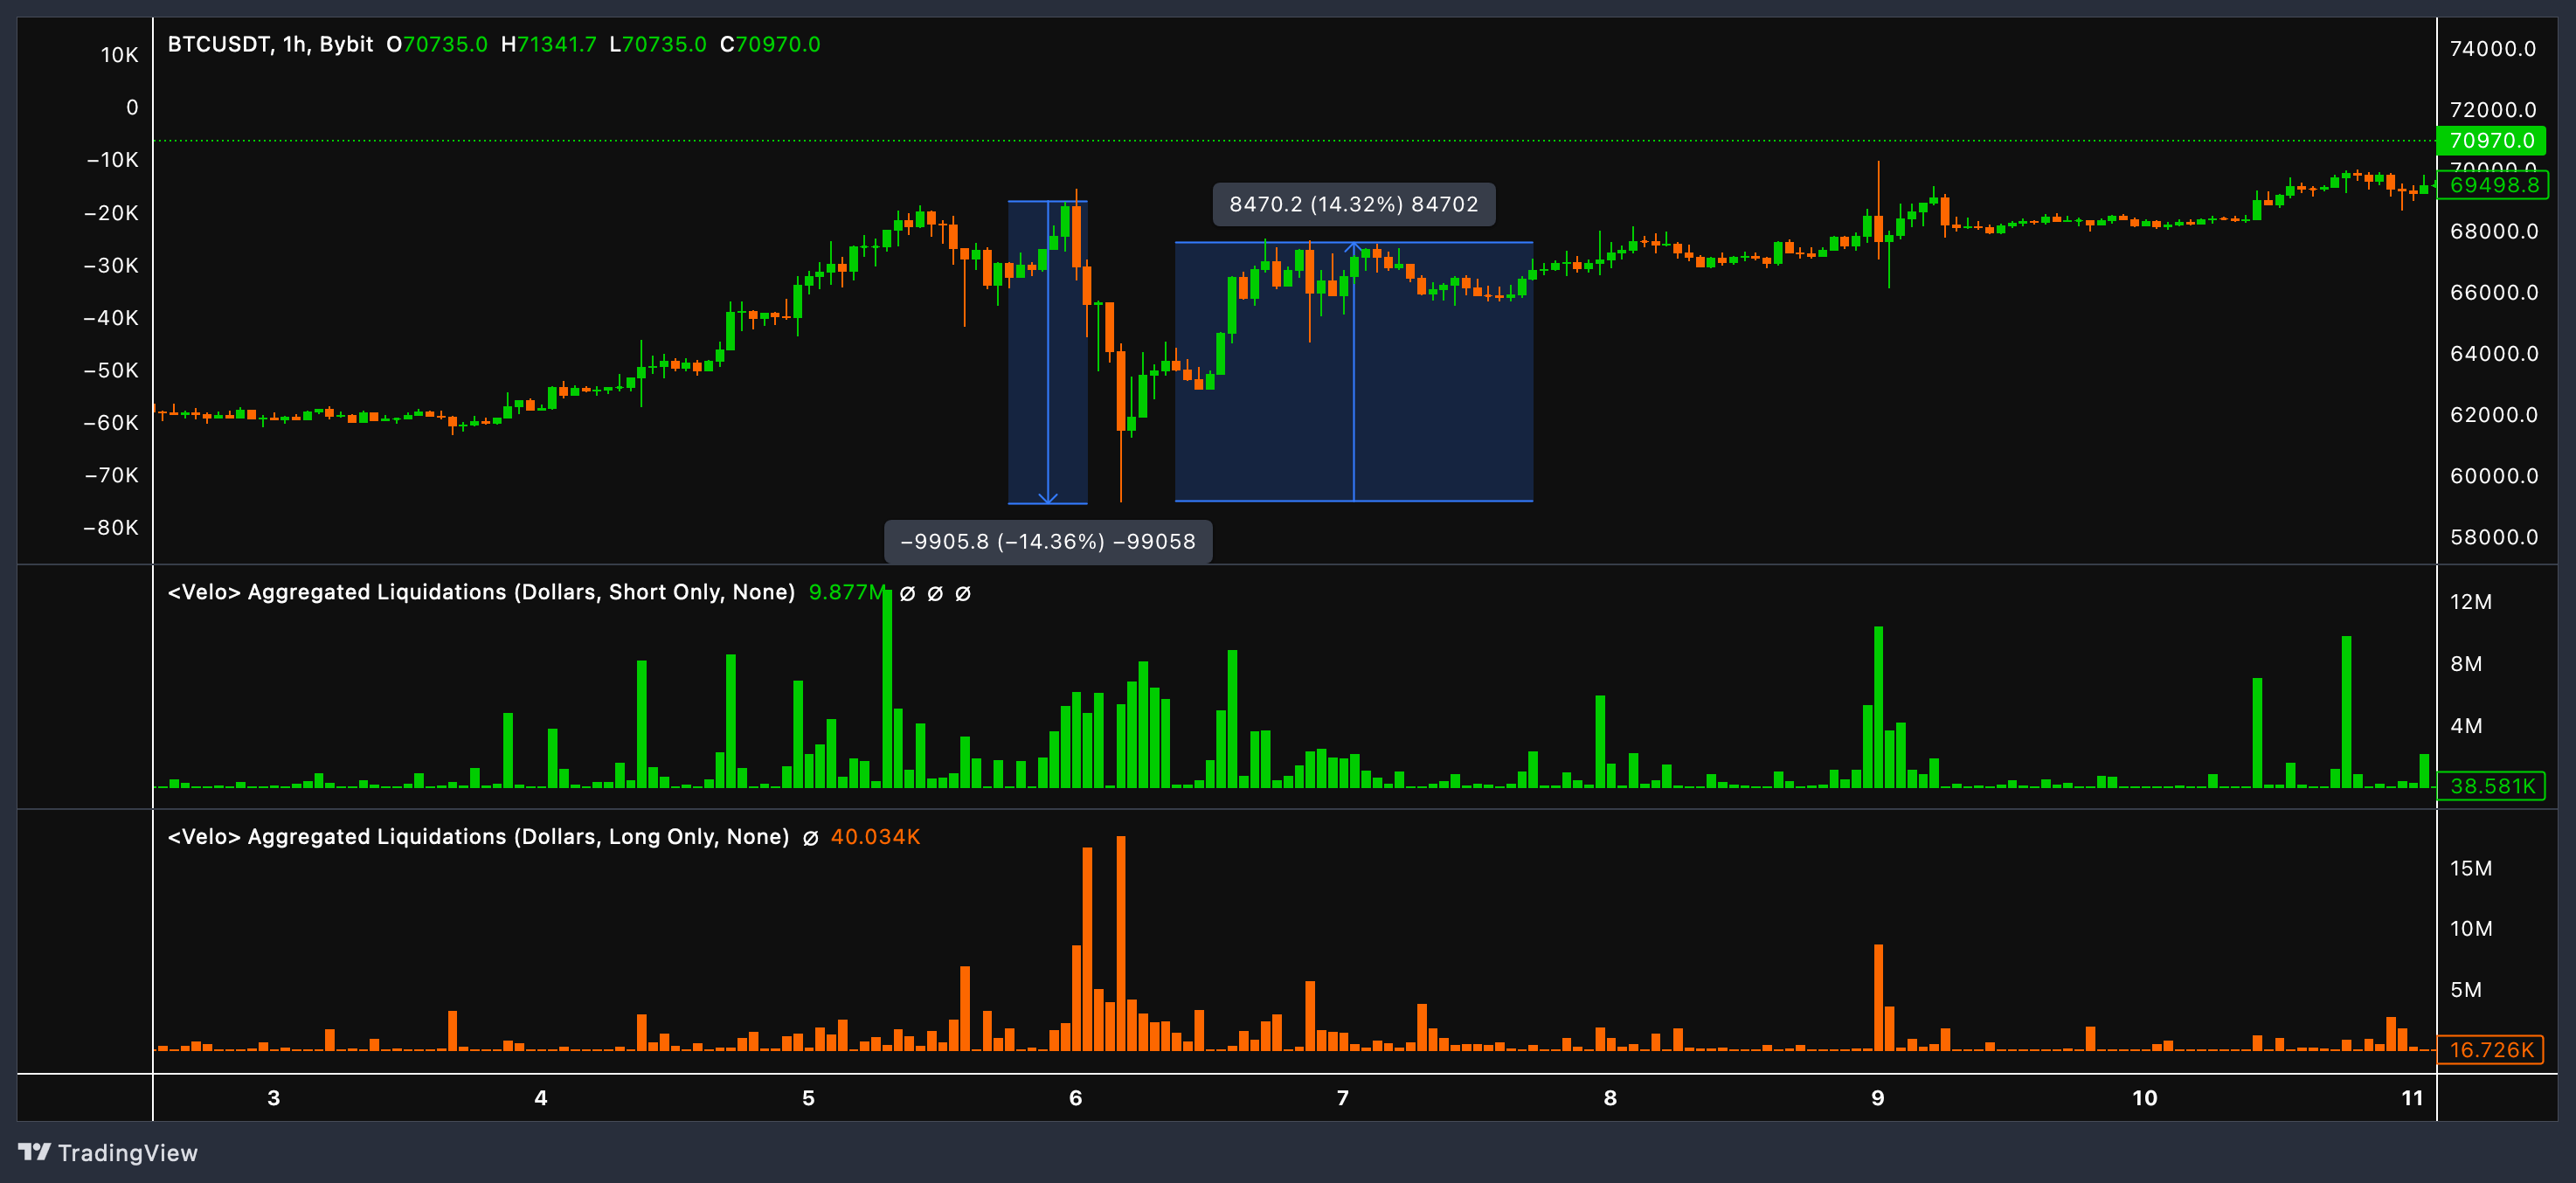
On the image above, longs were too much exposed and got punished as price fumbled. In that case, opting for a mean reversion strategy, wait for the Liquidation cascade to stop, volume to be muted, Orderbook getting thinner on ask side then you can start to enter in position and catch the reversal.

You can make your liquidation reversal trading bot on Runbot as shown above, through our Liquidation indicator powered by VeloData.
Liquidations are closely linked with Open Interest, which is the total number of outstanding derivative contracts, like futures or options, that have not been settled. High Open Interest indicates more potential for liquidation under volatile conditions. Before a big move, watch for a high level of Open Interest combined with a thinning order book near key resistance or support levels (Point of control, Orderblocks…). It’s a hint that liquidations could be on the horizon, leading to big price movements.
2. Cumulative Volume Delta (CVD) :
- What It Is: The Cumulative Volume Delta (CVD) is a vital indicator that measures the cumulative difference in volume between buy and sell orders, offering insights into market dominance by buyers or sellers.
- How It Works: CVD tallies the volume of buy orders against sell orders, highlighting the overall market pressure. An increasing CVD indicates strong buying pressure, whereas a decreasing CVD points to growing selling pressure.
When using Cumulative Volume Delta (CVD), it’s most effective to focus on the intraday or 5-minute time frames. Looking at CVD on higher time frames (HTF) tends to be misleading because the edge in using this indicator lies in identifying discrepancies where market buying or selling activities aren’t accurately reflected in the price movements. These opportunities typically arise within the day, allowing traders to respond promptly as the market adjusts to these disparities.
It’s important to note that limit orders are not included in the CVD calculations. This exclusion is crucial because CVD aims to capture the immediate market sentiment driven by market orders, providing a clearer picture of aggressive buying or selling pressures that influence price directions in real-time.
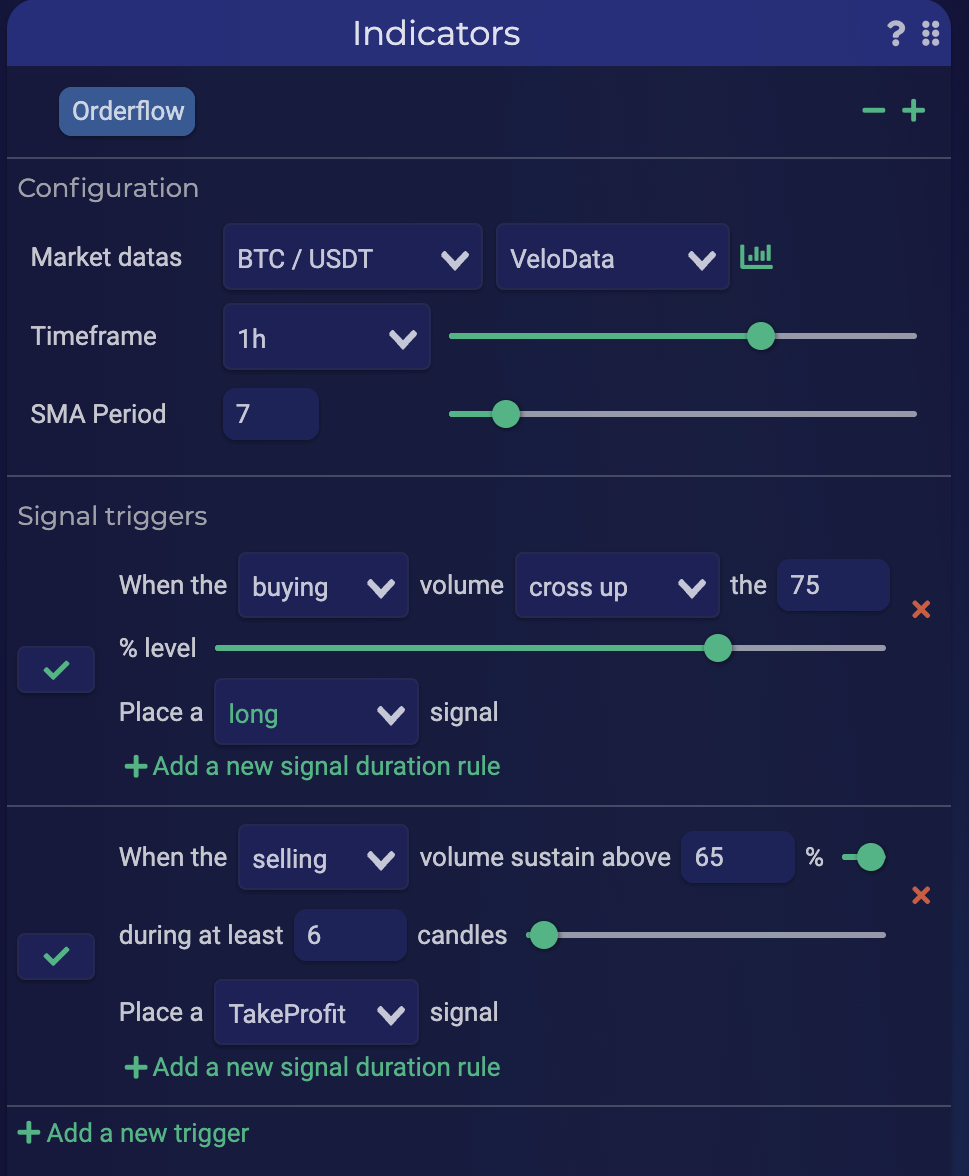
You can find our CVD indicators on Runbot under the name “Orderflow” as shown right above.
3. Volume Weighted Average Price (VWAP) :
The Volume Weighted Average Price (VWAP) was developed in the 1980s as a benchmarking tool to help institutions assess the effectiveness of their order execution. This metric not only served as a gauge to ensure that transactions were executed at advantageous prices, but it also helped identify key areas of price control within the market. VWAP has since become an essential indicator for determining both the quality and timing of buys and sells across various trading environments.
- What it Is: The Volume Weighted Average Price (VWAP) serves as a trading benchmark, calculating the average price a security has traded at throughout the day, based on volume and price.
- How it Works: VWAP is determined by totalling the dollar amount of all transactions (price times shares traded) and dividing by the total number of shares traded, helping traders determine if a stock is relatively cheap or expensive.
- How It is calculated: It’s based on participant behavior. VWAP is the summation of typical price * volume traded at price for the chosen time period divided by the total volume traded over that same time. The typical price is calculated by averaging high, low, and close.
- Understanding Market Control through VWAP
- The Volume Weighted Average Price (VWAP) serves as a critical gauge for identifying who holds the control in the market based on the current price’s position relative to the VWAP. When the price is below the VWAP, sellers dominate the market dynamics; conversely, when the price is above the VWAP, buyers are in control.
- VWAP: The Volume Warzone
- Consider the VWAP as the pivotal front line in a market’s battlefield. For instance, during a persistent downtrend, an anchored VWAP can highlight crucial zones where buyers need to intervene decisively to challenge and potentially reverse the dominance of sellers. This strategic point can signal possible shifts in market power and trend directions.
- Dynamic Nature of VWAP
- Owing to its dynamic nature, the VWAP is not just a simple average; it acts as a moving point of control or a focal area of interest within the market. This makes it an invaluable tool for traders to identify not only the average price based on volume but also key strategic levels where significant trading activities could occurs.
-
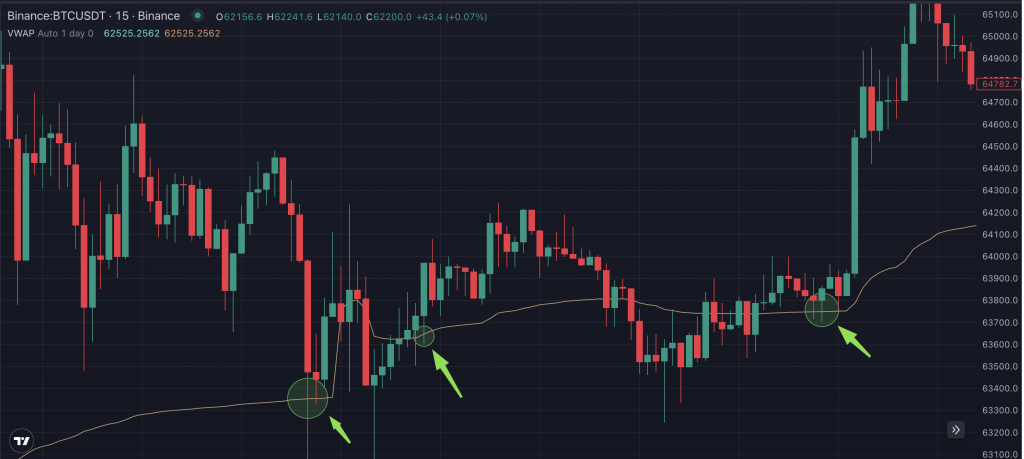
VWAP used for trend continuation on Runbot (Runbot.io)
4. Market Profile :
- What it Is: Market Profile is a comprehensive statistical tool that displays the price and time dynamics within a market, going beyond simple chart analysis.
- How it Works: It represents prices along a vertical axis against time on the horizontal, forming a bell-shaped curve. Areas where the market spends more time are highlighted, showing key support or resistance zones, aiding in identifying market balance and imbalance points.
Market Profile (MP) is a tool used to analyze the distribution of trading activity within the market, with MP focusing on the time spent at various price levels. These methods organize data on charts in a way that goes beyond the typical price charts commonly used by traders. By visualizing these profiles, we can better understand the market and volume structures, providing context and insight into the underlying market dynamics. These tools help illustrate that the market’s movements are not random or arbitrary but instead attempt to follow normal distribution curves. Although the market often deviates from these curves—making trading challenging—it underscores the complexity and patterns inherent in market behavior.
5. Keltner Channels :
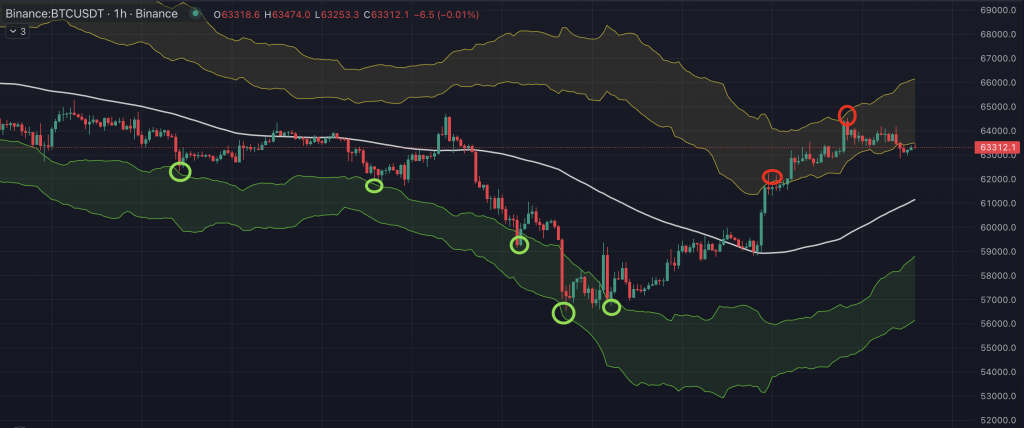
- What it Is: Keltner Channels are volatility-based channels set above and below an exponential moving average (EMA), used to gauge market volatility.
- How it Works: Set typically at two times the Average True Range (ATR) above and below a 20-day EMA, these channels define normal price range boundaries. Breakouts beyond these bands may indicate significant market moves such as breakouts or reversals.
- Meaning : Price reaching the upper Keltner Channel band is bullish while reaching the lower band is bearish.
- Recommendation : We like to use Keltner Channels to trade a range, for intraday or swings, 4 hours timeframe is recommended.
Keltner Channels are a volatility-based technical analysis indicator used in trading to identify potential overbought and oversold conditions, as well as to detect trend directions and potential breakouts. This indicator consists of three lines: a central line (typically an Exponential Moving Average, or EMA) and two outer bands. The distance of the outer bands from the central line is determined by multiplying the Average True Range (ATR) by a specified factor.
- Interpreting Keltner Channels:
-
- Trend Identification: The slope of the central EMA line indicates the overall trend direction. An upward sloping EMA suggests an uptrend, while a downward sloping EMA indicates a downtrend.
- Overbought and Oversold Conditions: Prices touching or exceeding the upper band may signal an overbought condition, suggesting a potential selling opportunity. Conversely, prices touching or falling below the lower band may indicate an oversold condition, suggesting a potential buying opportunity.
- Breakouts: Significant price movements beyond the Keltner Channel bands can indicate potential breakouts. A breakout above the upper band might signal the start of a strong uptrend, while a breakout below the lower band might indicate the beginning of a strong downtrend.
- Practical Use in Trading:
- Trend Following: Traders can use Keltner Channels to follow trends by entering long positions during uptrends and short positions during downtrends, using the central line and outer bands as guides for entry and exit points.
- Reversal Signals: Observing price movements that repeatedly test or breach the bands can help traders spot potential reversal points, allowing them to adjust their positions accordingly.
How to find the Best Trading Indicators for Algo Trading that fit my trading style ?
1. Define Your Trading Style
- Intraday Trading: If you trade throughout the day, look for indicators that respond quickly to price changes, like daily VWAP or intraday sessions of Market Profile.
- Swing Trading: For holding positions several days, indicators that identify trends and potential reversals, such as 4 hours time-frame Keltner Channels or the Weekly and above VWAPs, might be more appropriate.
2. Understand Different Types of Indicators
- Trend Indicators: Tools like moving averages or ADX can help identify the direction and strength of the market trend.
- Momentum Indicators: Instruments like RSI or Stochastic Oscillator can indicate if an asset is overbought or oversold, suggesting potential reversal points.
- Volume Indicators: These include the VWAP or Market Profile, which help validate how strong a price movement is based on the volume of trades.
- Volatility Indicators: Keltner Channels or Average True Range (ATR) provide insights into the stability of the price and how much it could swing.
3. Consider Your Trading Environment
- Market Conditions: Some indicators work better in trending markets while others excel in ranging markets. Identify the market condition you are most comfortable trading in and choose indicators that perform well in those environments.
- Asset Specificity: Certain indicators might perform better with specific assets due to the unique behaviors of those markets (e.g., crypto vs. forex).
4. Test and Validate
- Backtesting: Use historical data to see how your chosen indicators would have performed in the past. This can give you a sense of their effectiveness and reliability.
- Demo Trading: Before applying any new indicator in live trading, try it in a simulated environment to understand how it reacts in real-time without financial risk.
- Combination of Indicators: Sometimes, using a combination of two or three indicators can help in validating trading signals more effectively. However, be cautious of using too many indicators, as this can lead to analysis paralysis.
6. Education and Continuous Learning
- Educate Yourself: Take the time to learn about different indicators and how they are calculated. The more you understand the logic behind an indicator, the better you will be at interpreting its signals.
- Stay Updated: Trading strategies and markets evolve, so keep yourself updated with new tools and techniques.
- Runbot Documentation : Visit our technical documentation to learn how to use dozens of differents indicators
By following these steps, you can more confidently select trading indicators that are well-suited to your trading style and goals, thereby enhancing your decision-making process and potential for successful trading outcomes.
Conclusion
Each indicator plays a crucial role in trading, from assessing market dynamics and risk management to identifying potential entry and exit points. Explore them on Runbot and try every triggers available in order to find the one that suits your trading style.
Understanding and utilizing these tools effectively can significantly enhance a trader’s ability to make informed decisions based on current market trends, volatility, and volume.
Join our Runbot Discord Community to learn more about automated trading.