Bitcoin July 2025 Order Flow Analysis: Key Levels, VWAP Signals, and How to Backtest Them with Runbot
Bitcoin Technical & Order Flow Breakdown – July 2025
Bitcoin’s recent rally toward 110k$ has brought the asset into a critical decision zone. While bulls have dominated most of Q2 2025, current price action shows hesitation near major resistance. With liquidity thinning and divergences showing under the hood, it’s time to look deeper, not just at the candles, but at order flow, VWAP, and CVD behavior.
This breakdown explores the current market structure, key levels to watch, and how you can backtest these conditions directly in Runbot to build edge-driven strategies.
“Sometimes the candles lie. Order flow doesn’t.“
July has put Bitcoin in a dangerous spot: hovering around 110k$, bulls in control, but the tape is getting shaky. Under the surface, volume is thinning, divergences are stacking, and the move feels tired.
This isn’t just another TA breakdown. We’re digging into:
- VWAP dynamics
- Order flow shifts (Spot/Futures CVD)
- Open interest behavior
- How to backtest this setup directly with Runbot
📈 BTC at a Crossroads: Price Structure in Context
High Volume Node, No Follow Through?
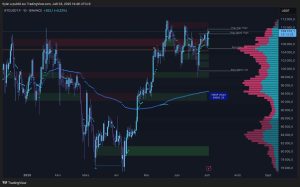
Bitcoin tapped previous weekly & daily highs (~110k$), but got stuck inside a thick VRVP node. Historically, this area acts like gravity, it attracts price, then either launches it or absorbs it.
Sitting on top: a bearish order block, built from institutional sell pressure. The fact we stalled here? That’s no coincidence. That’s smart money defending.
🔍 Macro Anchors: VWAP & Demand Zones
Yearly VWAP ≈ 94k$: Think of this as the battlefield midpoint. Above it = buyers winning. Lose it = structure breaks.
Below that? A solid demand block at 100k$ and between 88k$-92k$, the origin of the last impulse leg. If bulls want to stay in the game, they must defend this zone with everything.
📊 Order Flow Breakdown: CVD & Open Interest
The real story lies beneath the candles.
Here’s what order flow reveals:
Spot CVD Divergence (Bearish)
Price made new highs. Spot CVD didn’t follow. That’s a clear lack of real buying interest.
Futures CVD (Exhaustion)
The rebound suggests shorts may be getting squeezed, but not aggressive long participation yet.
Open Interest (Distribution)
In this image, Spot CVD is still declining, and Futures CVD just barely rebounded.
That suggests the OI rise might include aggressive short positions chasing the top (if CVD isn’t confirming buyer dominance).
If price drops now and OI drops sharply, it confirms: this was just a short squeeze trap or poor long entry.
If the price fails to hold above the breakout zone (~109k$–110k$), and OI unwinds fast, expect a flush scenario as overleveraged players exit.
🟢 Bullish Scenario: Breakout & Squeeze
What bulls want:
- Reclaim 112k$ on strong CVD & rising OI
- Delta support, stable funding, multiple 4H closes above
- This could opens a way to a new ATH
In short? Spot buyers must step in with conviction.

🔴 Bearish Scenario: Rejection & Distribution
Failing to break above 110k$, then rejecting 100k$ = red alert.
- Yearly VWAP at 95k$ becomes gravity
- 90k$-92k$ as temporary support
- Spot CVD diverging + OI falling = classic distribution setup
🧪 Backtesting this behavior with Runbot
You can simulate and validate these exact market behaviors using Runbot’s no-code backtesting engine.
Let’s explore together how to setup Runbot :
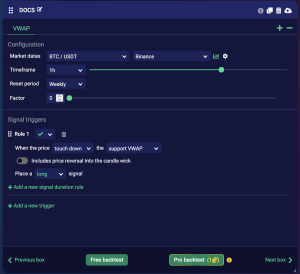
Step 1: Add VWAP indicators
Add VWAP indicator (indicator tab, volume section), setup the reset period on “weekly”, factor at “0”.
Only allow long entries when price touch down VWAP.
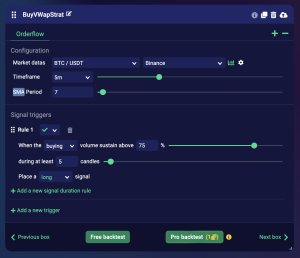
Step 2: Set Up CVD Divergence Logic
Use Orderflow (CVD) indicator to spot buying volume when touching VWAP.
- Add Orderflow indicator, setup it like the screenshot above.
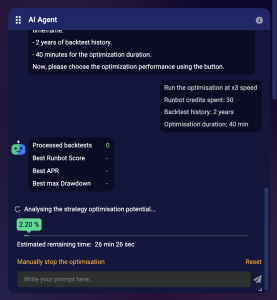
Bonus: Use Runbot’s AI Optimiser Agent
Go to the AI Agent box and start chatting with our Agent. (demo video here: https://www.youtube.com/watch?v=TXiL6Su-Pf4)
- The Agent will start optimizing and running multi-strategy backtests simultaneously across various quantitative metrics (including anti overfit rules).
Use the AI Agent to auto-optimize risk levels (take profit and stop loss levels).
🧠 Why Order Flow Gives You an Edge
Unlike basic indicators, order flow tools like Orderflow (CVD), Open Interest or even Liquidations let you see who is in control, buyers or sellers, and whether new positions are building or closing. It will bring you more confidence while buying a VWAP or EMA level for example.
Indicators give you signals. Order flow shows you conviction.
- Spot CVD tells you if buyers are really there
- OI shows whether positions are building or dying
- VWAP anchors you in reality
By incorporating volume-based metrics into your strategy, you gain context that raw price action can’t offer. These metrics are especially powerful in range-bound environments and breakout traps, exactly where Bitcoin is now.
📌 Key Technical Levels to Watch
Resistance: 110k$ → 112k$
Support: 100k$ → 94k$ → 90k$ (Major support + VWAP Yearly)